About Buzztracker
Buzztracking — Mapping News By Frequency And Location
Buzztracker is software written and designed by Craig Mod that visualizes frequencies and relationships between locations appearing in global news coverage.
Buzztracker tries to show you how interconnected the world is: big events in one area ripple to other areas across the globe. Connections between cities thousands of miles apart become apparent at a glance.
Buzztracker currently only tracks English-language news sources.
Follow the developer on Twitter (@craigmod).
Everymoment Now
Buzztracker has a sister project: Everymoment Now. Everymoment Now launched in September 2008 with a focus on the US '08 Election. EMN offers a much deeper look into news trends and the ebb and flow of people, events and keywords.
Press
Buzztracker has received press from newspapers and online communities around the world. This list hasn't been updated since 2006. There has been much hubbub since 2006, but it has gone unrecorded.
Dailybuzz
Find out how to add Buzztracker to your site.
Using Buzztracker
Buzztracker consists of two types of pages. Daily Indexes and Individual Location Indexes. Buzztracker is meant to be incredibly easy to use, but just to make sure there's no funny stuff going on, here is an explanation:
Daily Index
(buzztracker.org/year/month/day/index.html)

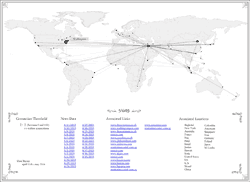
On the daily index page, you should see a list of cities with percentages next to them. The number represents the percentage of news stories that city is associated with for that day.
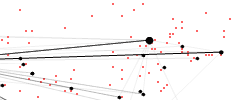
Locations that appear more often are represented by red circles on the map. The more frequently the cities appear, the larger the circle. Connections between locations are determined by intercontextual referencing in news articles. These connections are represented by lines between locations. The stronger the connection, the darker the line.
Move the mouse over the map to read the location names. Click on a city and relevant news stories will appear. Click "+ Enlarge" to get a larger version of the world map.
Individual Location Indexes
(buzztracker.org/year/month/day/Location.html)

The top 20 locations for the day are listed on the far left. The currently selected location is highlighted.
The middle column -- "Associated Locations" -- lists locations appearing in the same articles as the selected location. The percentages represent the strength of association with the selected location in the left-hand column.
The right column -- "Associated Articles" -- lists all articles associated with the selected location in the left-hand column. The number to the left in parentheses is the number of times the location appears in the article. The articles are sorted by frequency.
Vellum & Drill Bits
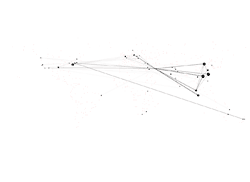
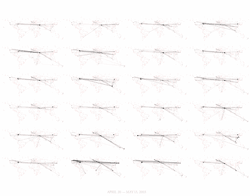
Much of the original output from spring 2003 was printed on semi-transparent vellum at 11"x14". The vellum was mounted between two pieces of 1/8" thick plexiglass. The glass was drilled, 1/2" from the edges on all four corners and four bolts were inserted. When lit from behind by a soft bulb, the image appeared to glow.
The output on the vellum was simply the frequency and inter-contextual relationship data as represented by dots and lines of varying size and opacity. There was no background image of a map.
Technical Details
The project was originally programmed in winter 2002-03 using Macromedia Director. Director allows rapid prototyping without much fuss. Director, despite being nice to prototype with, is a very slow language (not to mention, slowly dying). Especially for high-traffic web use. We had to fire Director; this was an easy decision. The hard decision was in finding a replacement. Actually, no, that also was easy. HTML and CSS provide enough functionality for a lean, mean Buzztracker. The current incarnation is meant to be as light and simple to navigate as possible. It is written in PHP and MySQL. New news data is dynamically added daily.
Maps & Population Data
The location database I compiled for this project is a stew of various sources. It was cleaned using population statistics and hand checked to get rid of dupes. Here are some of the resources I used when searching for location lists, population statistics, map information:
Maps:
CSU Mapmaker: A deceptively useful tool for generating simple, clean maps.
NASA: The spectacular blue marble image. (including that amazing city lights image)
Asia Historical Maps: Nice old map resource from the University of Texas.
Populations:
World Gazetter
Major Cities and Agglomerations of the World
Popin, global pop. statistics
Geohive, Global Pop. Statistics
Latitude-longitude search engine
THANKS
Thanks to the following people for their help through this project:
Bruce Rutledge
Dana Tomlin
Joshua Mosley
Bjoern Hartmann (PHP news collection routines)
Matt Roberts
Amy Calhoun
Norm Badler
k10k
- Craig Mod
LICENSE

The images on this site (buzztracker.org) are licensed under a Creative Commons License (Attribution-NonCommercial-ShareAlike).
RSS
Buzztracker offers a daily RSS feed of the latest image and top 10 locations. You can subscribe via this link.
CONTACT
Please send feedback to trackme [_@_] buzztracker.org.
MAILING-LIST
Signup for notices on updates to buzztracker & other Chin Music Press projects. Addresses will never be sold or distributed in any way. In fact, we know how annoying pointless emails can be so our mailings are usually few and far between.


